Validation: 2D Coupled Lattice Boltzmann and Finite Difference, Turbulent Flow, Turbulent transport
Description
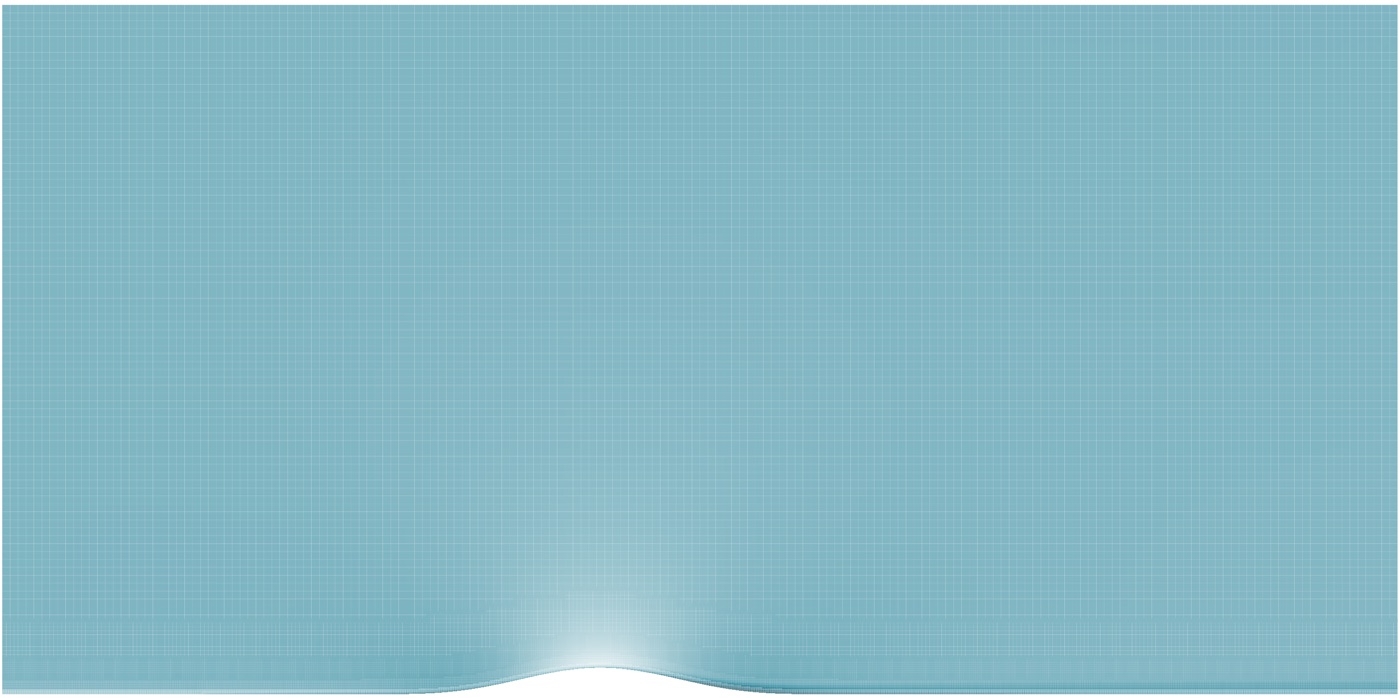
Turbulent, flow over a symmetric bump shape in 2D. A uniform free stream enters at the inlet and runs over a symmetry (slip) section before reaching the no-slip bump, where the boundary layer develops from the leading edge. A final symmetry section extends from the end of the bump to the outlet.
The wall is modelled with a wall function and the slip sections use a symmetry boundary. The top boundary is zero gradient and the outlet is an outlet condition. Eddy viscosity is set as 0.0 at the inlet and zero gradient on all other boundaries. The wall eddy viscosity is set using the wall function.
Simulation Inputs
| Input | Value |
|---|---|
| Material Properties | Density = 1.0 kg/m³, Viscosity = 2.29 × 10⁻⁵ m²/s. |
| Geometry | L = 1.5m, H = 1.3m. Bump geometry: for 0.3 < x < 1.2, y(x) = 0.0 for x < 0.3, x > 1.2. |
| Boundary Conditions | Inlet uniform velocity U∞ = 68.6 m/s. Reynolds number = 1.0*U∞/v = 3.0 × 10⁶. |
Assumptions and Notes
Flow is steady and incompressible.
Results
Skin friction vs CFL3D
Hover or tap the chart to read the values at any point. Click a legend item to show or hide it. Table values are interpolated to each station; the chart and CSV have the full distributions.
Skin friction along the wall: CFL3D vs FlowDeck, every 0.05 m
| x (m) | CFL3D C_f | FlowDeck C_f |
|---|---|---|
| 0.05 | 0.00434 | 0.00466 |
| 0.10 | 0.00396 | 0.00423 |
| 0.15 | 0.00370 | 0.00394 |
| 0.20 | 0.00350 | 0.00369 |
| 0.25 | 0.00330 | 0.00347 |
| 0.30 | 0.00309 | 0.00325 |
| 0.35 | 0.00279 | 0.00298 |
| 0.40 | 0.00250 | 0.00265 |
| 0.45 | 0.00243 | 0.00253 |
| 0.50 | 0.00272 | 0.00268 |
| 0.55 | 0.00340 | 0.00316 |
| 0.60 | 0.00443 | 0.00412 |
| 0.65 | 0.00559 | 0.00516 |
| 0.70 | 0.00637 | 0.00604 |
| 0.75 | 0.00615 | 0.00593 |
| 0.80 | 0.00487 | 0.00476 |
| 0.85 | 0.00320 | 0.00319 |
| 0.90 | 0.00192 | 0.00199 |
| 0.95 | 0.00127 | 0.00131 |
| 1.00 | 0.00114 | 0.00111 |
| 1.05 | 0.00135 | 0.00122 |
| 1.10 | 0.00173 | 0.00154 |
| 1.15 | 0.00211 | 0.00198 |
| 1.20 | 0.00235 | 0.00223 |
| 1.25 | 0.00247 | 0.00238 |
| 1.30 | 0.00255 | 0.00248 |
| 1.35 | 0.00259 | 0.00255 |
| 1.40 | 0.00262 | 0.00261 |
| 1.45 | 0.00265 | 0.00266 |
Velocity profile at x = 0.75 and 1.2 vs CFL3D
Hover or tap the chart to read the values at any point. Click a legend item to show or hide it. CFL3D values in the table are interpolated to the FlowDeck heights.
Velocity profiles at the FlowDeck points: FlowDeck vs CFL3D
| z (m) | x (m) | FlowDeck u/U∞ | CFL3D u/U∞ |
|---|---|---|---|
| 0.00080 | 0.75 | 0.9187 | 0.9717 |
| 0.00174 | 0.75 | 1.0638 | 1.0871 |
| 0.00267 | 0.75 | 1.1317 | 1.1475 |
| 0.00360 | 0.75 | 1.1729 | 1.1849 |
| 0.00453 | 0.75 | 1.2018 | 1.2105 |
| 0.00546 | 0.75 | 1.2229 | 1.2293 |
| 0.00640 | 0.75 | 1.2389 | 1.2436 |
| 0.00733 | 0.75 | 1.2516 | 1.2547 |
| 0.00826 | 0.75 | 1.2614 | 1.2629 |
| 0.00919 | 0.75 | 1.2683 | 1.2681 |
| 0.01013 | 0.75 | 1.2722 | 1.2701 |
| 0.01059 | 0.75 | 1.2736 | 1.2696 |
| 0.01246 | 0.75 | 1.2717 | 1.2639 |
| 0.01432 | 0.75 | 1.2658 | 1.2591 |
| 0.01618 | 0.75 | 1.2609 | 1.2545 |
| 0.01805 | 0.75 | 1.2566 | 1.2500 |
| 0.01991 | 0.75 | 1.2522 | 1.2456 |
| 0.02178 | 0.75 | 1.2479 | 1.2414 |
| 0.02364 | 0.75 | 1.2437 | 1.2372 |
| 0.02551 | 0.75 | 1.2397 | 1.2331 |
| 0.02737 | 0.75 | 1.2357 | 1.2292 |
| 0.02923 | 0.75 | 1.2319 | 1.2253 |
| 0.03017 | 0.75 | 1.2301 | 1.2234 |
| 0.03390 | 0.75 | 1.2229 | 1.2160 |
| 0.03762 | 0.75 | 1.2159 | 1.2090 |
| 0.04135 | 0.75 | 1.2092 | 1.2023 |
| 0.04508 | 0.75 | 1.2029 | 1.1959 |
| 0.04881 | 0.75 | 1.1968 | 1.1898 |
| 0.05254 | 0.75 | 1.1910 | 1.1840 |
| 0.05627 | 0.75 | 1.1854 | 1.1784 |
| 0.00047 | 1.2 | 0.4756 | 0.4979 |
| 0.00140 | 1.2 | 0.5753 | 0.5856 |
| 0.00233 | 1.2 | 0.6159 | 0.6272 |
| 0.00326 | 1.2 | 0.6432 | 0.6567 |
| 0.00419 | 1.2 | 0.6658 | 0.6812 |
| 0.00513 | 1.2 | 0.6862 | 0.7031 |
| 0.00606 | 1.2 | 0.7055 | 0.7237 |
| 0.00699 | 1.2 | 0.7241 | 0.7434 |
| 0.00792 | 1.2 | 0.7424 | 0.7625 |
| 0.00886 | 1.2 | 0.7606 | 0.7812 |
| 0.00979 | 1.2 | 0.7787 | 0.7995 |
| 0.01025 | 1.2 | 0.7874 | 0.8085 |
| 0.01212 | 1.2 | 0.8234 | 0.8433 |
| 0.01398 | 1.2 | 0.8592 | 0.8756 |
| 0.01585 | 1.2 | 0.8943 | 0.9044 |
| 0.01771 | 1.2 | 0.9274 | 0.9285 |
| 0.01958 | 1.2 | 0.9542 | 0.9464 |
| 0.02144 | 1.2 | 0.9691 | 0.9568 |
| 0.02330 | 1.2 | 0.9733 | 0.9602 |
| 0.02517 | 1.2 | 0.9738 | 0.9607 |
| 0.02703 | 1.2 | 0.9740 | 0.9609 |
| 0.02797 | 1.2 | 0.9745 | 0.9610 |
| 0.02890 | 1.2 | 0.9745 | 0.9611 |
| 0.03076 | 1.2 | 0.9750 | 0.9614 |
| 0.03169 | 1.2 | 0.9753 | 0.9615 |
| 0.03542 | 1.2 | 0.9757 | 0.9619 |
| 0.03915 | 1.2 | 0.9759 | 0.9624 |
| 0.04288 | 1.2 | 0.9766 | 0.9629 |
| 0.04661 | 1.2 | 0.9773 | 0.9634 |
| 0.05034 | 1.2 | 0.9778 | 0.9639 |
Reference Data
Skin friction and velocity profiles are compared against numerical CFL3D results from the NASA TMR turbulent bump case [1].
References
- Turbulent Modelling Resource, Bump, https://tmbwg.github.io/turbmodels/.
Data licence. The model results on this page and in the CSV downloads are published by FlowDeck under the Creative Commons Attribution 4.0 licence (CC BY 4.0). The reference values are from the sources listed under References.