Background
Askervein Hill is a 126m high hill on the west coast of the island of South Uist in the Outer Hebrides of Scotland. In 1982 and 1983, two field campaigns were conducted on and around the hill, with measurements made of the speed-up over the hill under neutral atmospheric stability conditions. This experiment has since been used as a scientific benchmark within various fields, particularly in CFD for its relevance to boundary layer flow. In this instance, the Askervein Hill has been used as a benchmark for the Flowdeck solver in replicating the physical behaviour and fluid dynamics seen in the experiment.
Problem Description
The hill is modelled with the hilltop (HT) and centrepoint (CP) at (0.0, 0.0, 128.61) and (-88.46, -384.78, 119.48) and surrounded terrain bounded in a 2750 x 2750 x 2750 flow domain. Wind flows at a speed of 10 m/s at 10 m above the terrain and at an angle of 210°.
In line with the original experiment, monitor probes have been set up within the domain in a line in the direction of the original wind mast locations. These capture the velocity at the same heights as the masts, and the velocity profile across the HT and CP lines. The locations of the original masts can be seen below in Figure 1.
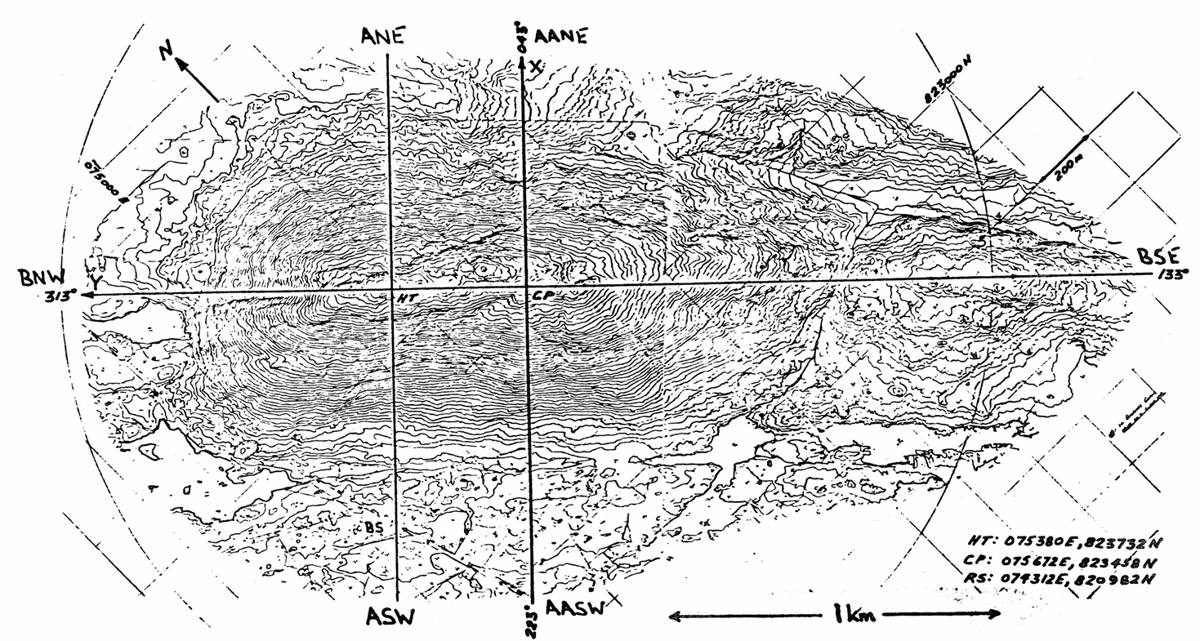
The simulation produces outputs for velocity at 10m, from which the fractional speed-up ratio is calculated from the following equation:
Where is the inlet velocity (10 m/s), is the mean velocity at reference height z (10m) and FSR is fractional speed-up ratio.
Set-up
| Settings | Value |
|---|---|
| Domain Size | 2750 m |
| Base cell | 68.75 |
| Finest cell | 4.3m |
| Wind speed | 10 m/s |
| Wind direction | 210° |
| Reference Height | 10 m |
| Terrain Roughness (z0) | 0.02m, Open Terrain |
| Terrain source | WaSP map |
| LES | SA |
Results
Fractional Speed-up Ratio along CP AA Line
Hover or tap the chart to read the values at any point. Click a legend item to show or hide it. Error bars show the experimental FSR range. Experimental speeds are as measured and are not normalised to the 10 m/s inlet.
View data table: experimental masts vs model
| Mast | Sensor | Distance (m) | Mast z (m) | Exp. FSR | Exp. range (− / +) | Exp. measured speed (m/s) | OpenFOAM FSR | Flowdeck FSR |
|---|---|---|---|---|---|---|---|---|
| AASW70 | FRG cup | −683.4 | 11.5 | −0.086 | 0.034 / 0.032 | 8.25 | −0.103 | −0.094 |
| AASW60 | FRG cup | −587.2 | 10.3 | −0.140 | 0.039 / 0.038 | 7.77 | −0.154 | −0.144 |
| AASW50 | FRG cup | −491.0 | 12.1 | −0.266 | 0.037 / 0.038 | 6.63 | −0.282 | −0.276 |
| AASW40 | FRG cup | −390.1 | 26.5 | −0.218 | 0.023 / 0.023 | 7.06 | −0.208 | −0.198 |
| AASW30 | FRG cup | −287.4 | 54.2 | −0.019 | 0.027 / 0.023 | 8.86 | 0.001 | 0.007 |
| AASW20 | FRG cup | −190.6 | 80.4 | 0.184 | 0.038 / 0.035 | 10.69 | 0.163 | 0.163 |
| AASW10 | AES gill uvw | −94.1 | 103.2 | 0.456 | 0.045 / 0.042 | 13.15 | 0.436 | 0.438 |
| CP (cup) | FRG cup | 0.0 | 115.5 | 0.569 | 0.044 / 0.046 | 14.17 | 0.515 | 0.511 |
| AANE10 | FRG cup | 101.9 | 108.6 | 0.680 | 0.046 / 0.041 | 15.17 | 0.632 | 0.622 |
| AANE20 | FRG cup | 194.6 | 84.3 | −0.057 | 0.040 / 0.030 | 8.52 | 0.202 | 0.149 |
| AANE30 | FRG cup | 285.8 | 63.5 | −0.191 | 0.027 / 0.025 | 7.31 | −0.177 | −0.239 |
| AANE40 | FRG cup | 382.7 | 41.5 | −0.403 | 0.047 / 0.042 | 5.39 | −0.359 | −0.432 |
| AANE60 | FRG cup | 577.9 | 29.2 | −0.260 | 0.047 / 0.041 | 6.68 | −0.268 | −0.274 |
Fractional Speed-up Ratio along HT A Line
Hover or tap the chart to read the values at any point. Click a legend item to show or hide it. Error bars show the experimental FSR range. Experimental speeds are as measured and are not normalised to the 10 m/s inlet.
View data table: experimental masts vs model
| Mast | Sensor | Distance (m) | Mast z (m) | Exp. FSR | Exp. range (− / +) | Exp. measured speed (m/s) | OpenFOAM FSR | Flowdeck FSR |
|---|---|---|---|---|---|---|---|---|
| ASW85 | AES gill uvw | −839.2 | 10.7 | −0.093 | 0.045 / 0.045 | 7.80 | −0.045 | −0.060 |
| ASW50 | AES gill uvw | −490.5 | 11.5 | −0.221 | 0.046 / 0.046 | 6.70 | −0.200 | −0.206 |
| ASW35 | AES gill uvw | −326.5 | 34.9 | −0.163 | 0.065 / 0.065 | 7.20 | −0.156 | −0.159 |
| ASW20 | AES gill uvw | −184.2 | 75.5 | 0.221 | 0.004 / 0.004 | 10.50 | 0.054 | 0.020 |
| ASW10 | AES gill uvw | −95.9 | 109.0 | 0.535 | 0.042 / 0.042 | 13.20 | 0.543 | 0.549 |
| HT | AES gill uvw | 0.0 | 124.6 | 0.884 | 0.065 / 0.065 | 16.20 | 0.729 | 0.729 |
| ANE10 | AES gill uvw | 102.1 | 107.8 | 0.395 | 0.046 / 0.046 | 12.00 | 0.307 | 0.239 |
| ANE20 | AES gill uvw | 201.7 | 84.3 | −0.349 | 0.044 / 0.044 | 5.60 | −0.066 | −0.137 |
| ANE40 | AES gill uvw | 392.6 | 41.3 | −0.651 | 0.083 / 0.083 | 3.00 | −0.415 | −0.424 |
References
| No. | Reference | Source |
|---|---|---|
| [1] | weMEP | The Askervein Isolated Smooth Hill (Askervein) — Wind Energy Model Evaluation Protocol: https://wemep.readthedocs.io/en/latest/windconditions/benchmarks/askervein.html |
| [2] | ASK83 | The Askervein Hill Project: Report on the Sept./Oct. 1983, Main Field Experiment: https://www.yorku.ca/pat/research/Askervein/ASK83.pdf |
Data licence. The model results on this page and in the CSV downloads are published by FlowDeck under the Creative Commons Attribution 4.0 licence (CC BY 4.0). The experimental values are from Javier Sanz Rodrigo, “Input and validation data for the Askervein Hill benchmark” (Zenodo, 2014, doi:10.5281/zenodo.4095052), digitised from the original reports of Taylor and Teunissen and published under CC BY 4.0. We converted the mast positions to distances along each line.